Advertisement

Google makes climate data more accessible with new Google Earth tools

Climate scientists work with Google and other organizations to make climate change more personal.

By Brooks Hays
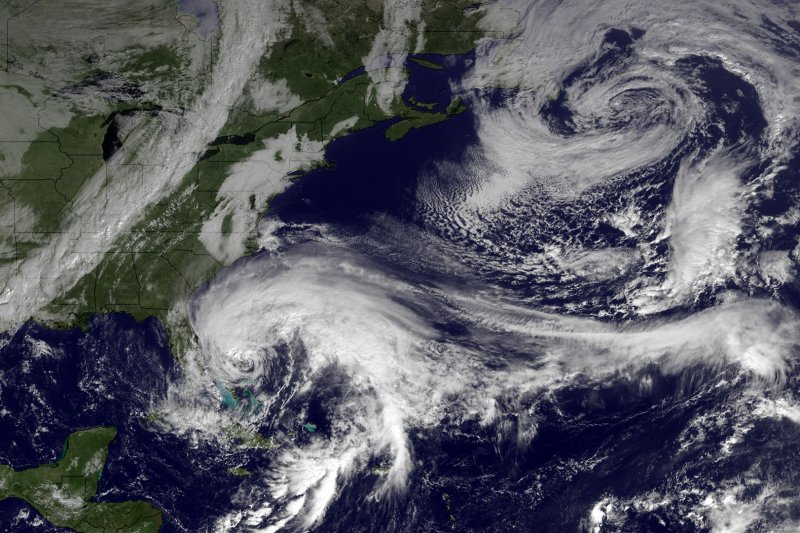
This NOAA satellite image shows Hurricane Sandy as it moves northward along the East Coast of the United States. (File/UPI/NOAA)
This NOAA satellite image shows Hurricane Sandy as it moves northward along the East Coast of the United States. (File/UPI/NOAA) | License Photo

LONDON, Feb. 6 (UPI) -- Researchers in the UK have embedded climate data onto the Google Earth platform, allowing users to visualize changes in weather and temperature over time, and in some instances reference records as far back as 1850.

The project, carried out by climate scientists at the University of East Anglia, is part of a broader effort by those who study climate change to make the worrisome phenomenon more accessible and transparent to the broader public. The effort also helps to localize the problem of climate change, allowing users to see how the weather in their backyard and within their region is changing over time.
Advertisement

“The beauty of using Google Earth is that you can instantly see where the weather stations are, zoom in on specific countries, and see station datasets much more clearly,” Tim Osborn from UEA’s Climatic Research Unit told The Hindu.

Osborn and researchers in UK aren't alone in their attempts to engage the broader public on climate change. American environmental advocates are working toward similar ends.

Polls suggests more and more Americans are convinced that climate chance is happening -- 61 percent, by one count. But only a little more than a third of Americans think they will be harmed a “moderate amount” or a “great deal” by the planet's warming. That's why climate scientists and policy makers are shifting their focus, not toward convincing skeptics, but encouraging a sense of urgency.

Advertisement

The U.S. Geological Survey has come up with their own tool that helps people better visualize climate change, and New Scientist created an interactive world map that plots temperatures over the last 20 years.

Scientists hope personalizing data will increase viewers' level of concern, and ultimately spur action.

[The Hindu.] [New Scientist] [U.S. Geological Survey]

Latest Headlines