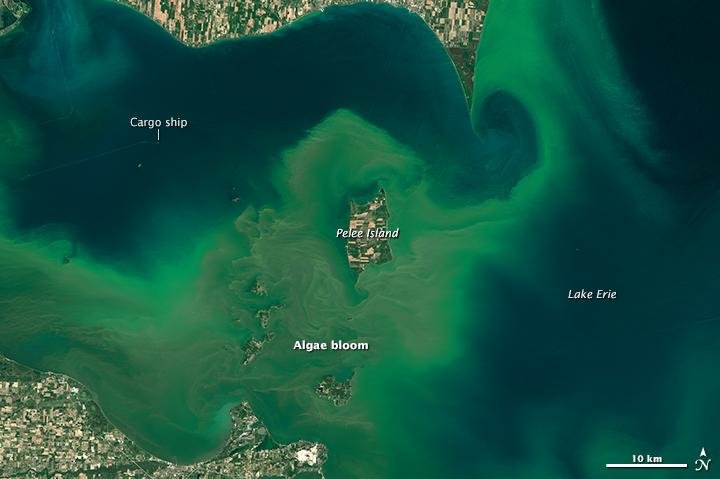
Toxic algae blooms are a growing problem in Lake Erie. Photo by NASA/Landsat 8
May 15 (UPI) -- Thanks to new satellite data and an updated prediction model, researchers have a better understanding of the drivers of toxic algal blooms in Lake Erie.
Researchers with the Carnegie Institution for Science used images from the Landsat 5 satellite to increase the archive of historical algal blooms estimates, and more than doubled the number of years available to scientists.
The larger dataset improved prediction models and revealed the importance of decade-long accumulation of phosphorus. Until now, models focused exclusively on yearly-phosopherous inputs, but analysis showed longterm phosphorus loading in inflowing waterways is an equally important predictor of algal blooms.
When fertilizers from farms are washed away into local waterways, the influx of nutrients like phosphorus flows downstream where it can become concentrated and encourage the growth of aquatic plants and phytoplankton, like blue-green algae.
Algal blooms can rob lakes of oxygen, suffocating fish and other aquatic species. Blue-green algae produces a toxin that can poison animals and harm the livers of humans who consume the water. Toxins can also irritate the skin of those who swim in tainted water.
Toxic algal blooms are a growing problem for Lake Erie and the cities and towns that draw their drinking water from the lake.
"The water quality in the western portion of Lake Erie has been declining for two decades," researcher Jeff Ho said in a news release. "Some 11 million people depend on Lake Erie for drinking water."
Scientists analyzed modern bloom measurements and satellite imagery to develop an algorithm capable of predicting the scope of previous blooms. Researchers used the algorithm and archival satellite data to estimate historical blooms. When they plugged into the additional data to prediction models, the researchers realized a combination or yearly and decade-long phosphorus loading could account for 75 percent of bloom variability.
Researchers detailed their approach in Remote Sensing of Environment and Journal of Great Lakes Research.
"The cumulative phosphorus load, indicative of long-term trends in bloom size, was the key to understanding why some blooms had occurred during years with very little spring phosphorus runoff," Ho said.


