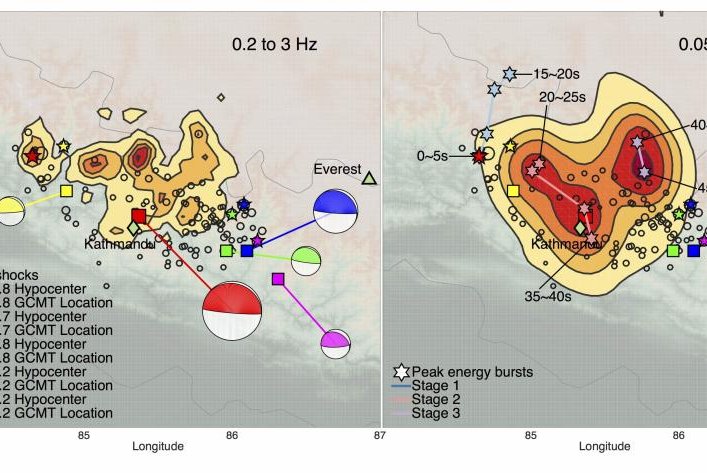
Images show the movement of Nepal's deadly 2015 earthquake. Photo by AGU/Scripps
SAN DIEGO, July 23 (UPI) -- Those who survived the deadly 7.8-magnitude earthquake that ravaged Nepal in April of 2015 likely have little interest in detailing the deadly quake's trajectory. But that's exactly scientists at the University of California, San Diego have done.
In effort to better understand the movement of major earthquakes, researchers have mapped out how the rumbles played out over the course of several harrowing minutes. The map shows the movement of low and high frequency waves as they emanated from the quake's epicenter. Researchers have divided the trajectory of the tremor into three stages.
"The Nepal earthquake is a warning sign that the region is of high seismic risk, and each earthquake behaves differently," Peter Shearer, a geophysicist at UC San Diego's Scripps Institution of Oceanography, said in a press release. "Some earthquakes jump from one fault line to another, whereas the Nepal quake apparently occurred on the same fault line in three different stages, moving eastward. Using this research, we can better understand and identify areas of high seismic hazard in the region."
Using data from the Global Seismic Network, Shearer and his research partners plotted the effects of each fault slip. Together, this evolution of slips produced a devastating three-stage quake -- one that killed 9,000 and injured 23,000 more. The Red Cross says thousands are still in need of aid.
As detailed in the new map, the fault line running through Nepal slipped in three places, each rupture moving eastward. The first stage featured mostly weak and slow-moving rumbles. The second stage, which occurred near Kathmandu, featured the most dramatic slip, but produced relatively few high-frequency waves. The third stage was also relatively slow. But within and between each stage were more complex multi-stage, multi-fault movements. Some 38 aftershocks were felt during the day following the three-stage earthquake.
"Using the GSN instead of regional array data really enhanced the spatial resolution of the back-projection images and helped us see that frequency-dependent rupture was one of the main features of this earthquake," explained Scripps graduate student Wenyuan Fan. "Stage 2 was high-frequency-deficient and occurred closest to Kathmandu, which was probably why ground shaking was less severer than expected for such a high-magnitude earthquake."
Fan and Shearer, whose work was funded by a grant from the National Science Foundation, published their map this week in the Geophysical Research Letters.
"In general, understanding large earthquakes will inform our ability to forecast the nature of future earthquakes," added Shearer.
[Correction: A previous version of this story incorrectly stated the research was funded by the American Geophysical Union.]


